TL;DR: High Rates Have Drawn a Line Through Half the Buyer Pool
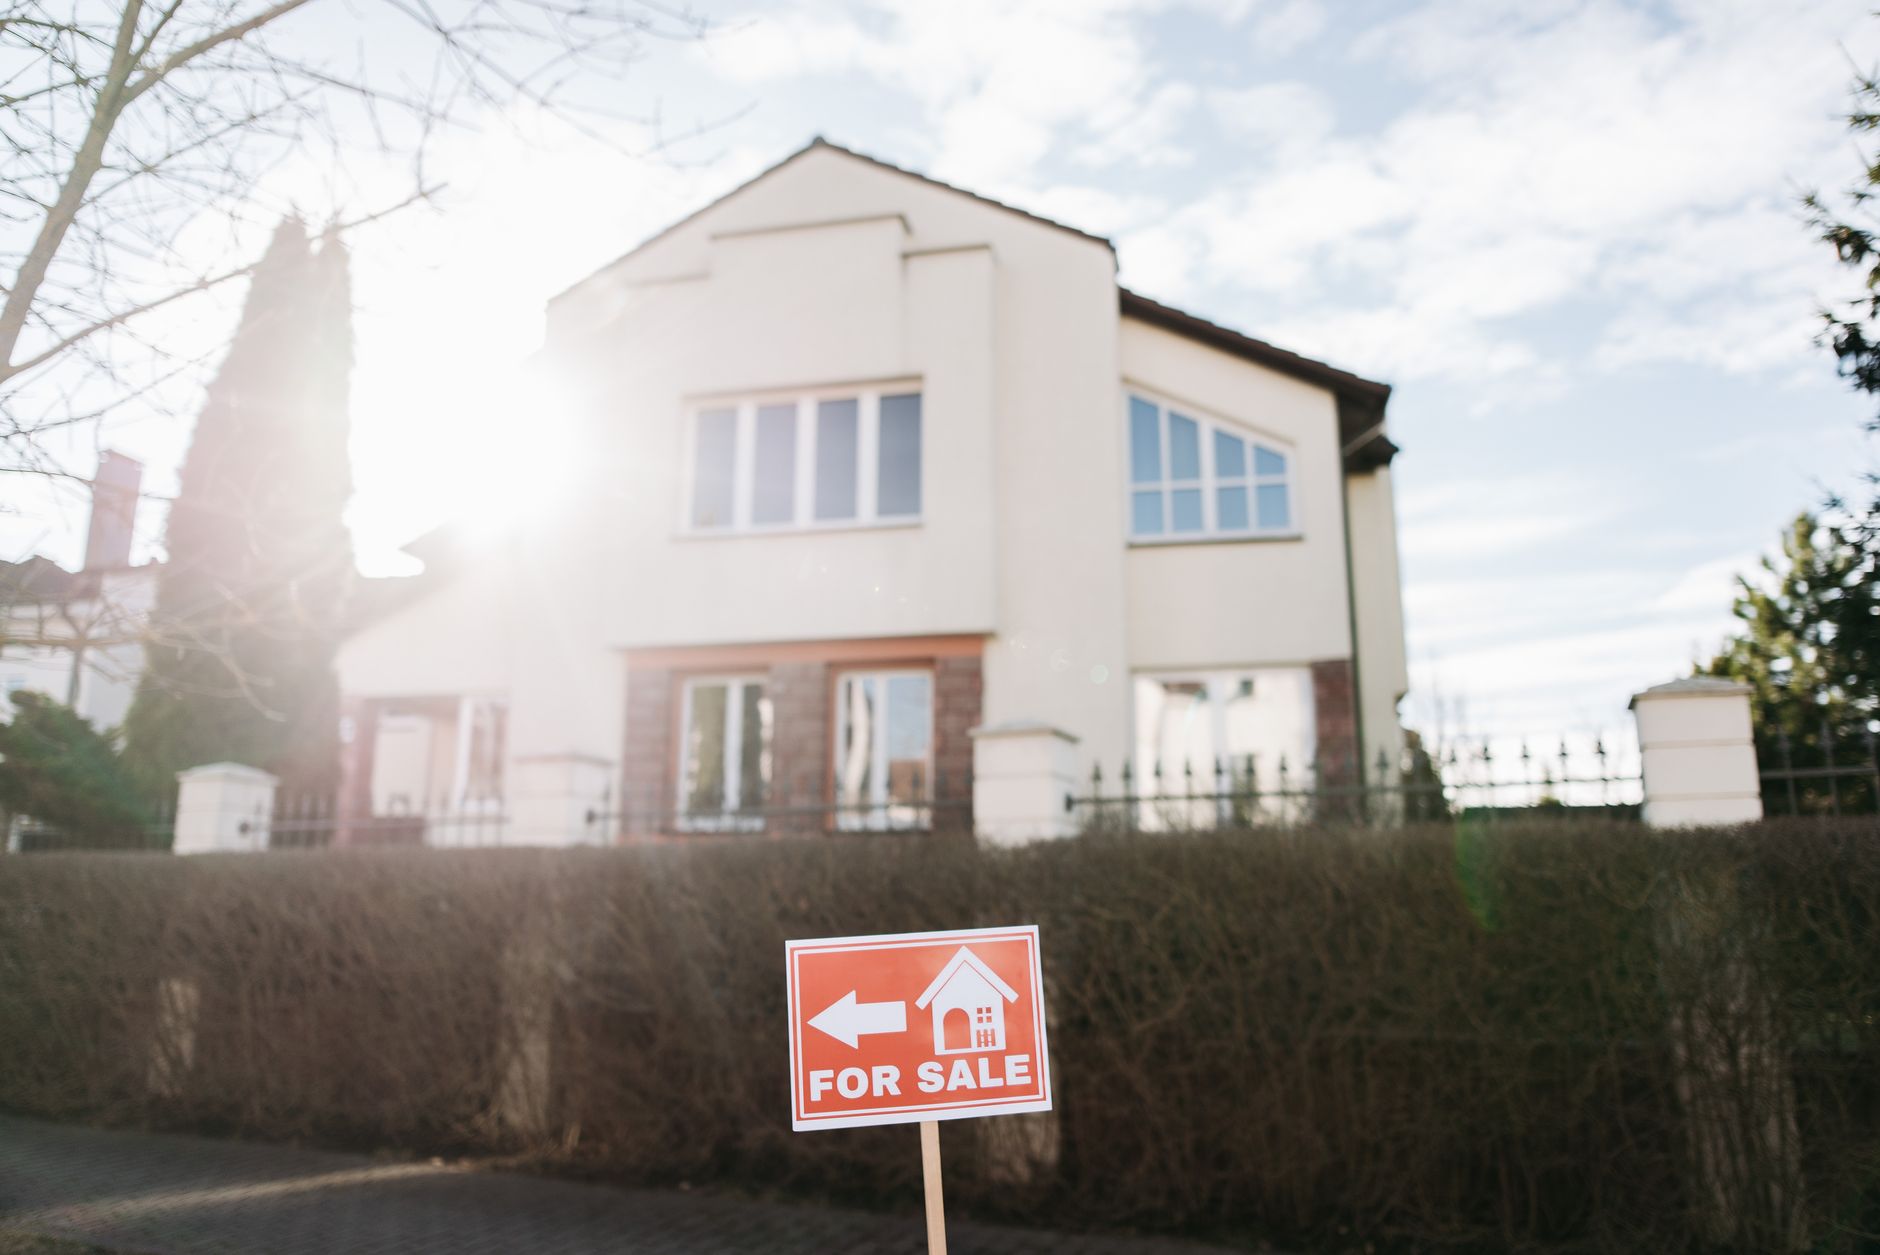
Homes are harder to sell in 2026 because the maths simply doesn’t work for a large chunk of would-be buyers. With the RBA cash rate holding at 4.35% and APRA’s serviceability buffer still at 3 percentage points, banks are assessing new loan applications at effective rates north of 9%. CoreLogic and ABS data show this has slashed maximum borrowing capacity by 32% since the cheap-money era of 2021, directly eliminating first-home buyers, upgraders, and investors from price points they would have comfortably reached three years ago. Meanwhile, listing volumes are up 18% year-on-year nationally, creating more competition for a smaller pool of qualified buyers. The result: longer days on market, falling auction clearance rates, and a widening gap between vendor expectations and what pre-approved buyers can actually pay.
The Numbers That Explain the 2026 Slowdown
To understand why selling a home feels harder than ever, sellers need to look at the intersection of three data series: borrowing power, inventory levels, and transaction velocity.
- RBA Cash Rate: 4.35% · No change since Nov 2023 · RBA
- Average Owner-Occupier Variable Rate: 6.72% · +0.05 pp · RBA Lenders’ Rates
- Maximum Loan Size (Median HH Income): ~$640,000 · -$15,000 · RBA / APRA
- National Listings Volume: 247,000 properties · +18% · CoreLogic
- National Transaction Volume (6-month rolling): -14% year-on-year · – · ABS / CoreLogic
- Median Days on Market (Private Treaty): 52 days · +14 days · CoreLogic
- Combined Capital City Auction Clearance Rate: 54.3% · -8.7 pp · CoreLogic
These six data points explain the story: borrowing capacity has collapsed, supply is up, demand is down, and auction rooms are quiet. Crucially, the slowdown is not limited to any single city — it is broad-based across Sydney, Melbourne, Brisbane, and even previously resilient Perth.
Why Pre-Approved Doesn’t Mean Ready to Buy
One of the most frustrating dynamics for sellers in 2026 is the gap between a buyer’s pre-approval and their actual willingness to transact. Australian banks have tightened credit policies in response to elevated arrears among borrowers who exited fixed-rate loans in 2023–24. A pre-approval in mid-2026 typically comes with stricter conditions:
- Smaller loan sizes: Lenders are applying haircuts to variable income, bonuses, and overtime.
- Higher buffers: Even though APRA’s formal buffer remains at 3%, some banks are internally applying 3.5% for certain borrower segments.
- Living expense scrutiny: HEM-based benchmarks have been supplemented with line-by-line transaction reviews, reducing effective disposable-income calculations.
The outcome is that a buyer who tells an agent “I’m pre-approved for $800,000” may only be willing to bid to $730,000 once they run their own stress-test numbers. This bid-ask spread is the single biggest reason transactions are falling through post-inspection.
Q: How can sellers bridge the gap between what they want and what buyers can pay?
The most effective approach in 2026 is pre-listing price discovery: getting a desktop valuation from three lenders and setting the guide at the lower end of the realistic range. Properties that list 5–8% below CoreLogic’s automated valuation model consistently attract 3+ registered bidders and sell closer to the vendor’s true reserve, whereas properties listed at or above the AVM linger and eventually sell at a discount.
Auction Clearance Rates Tell a Brutal Story
Auction clearance rates are the closest thing the property market has to a real-time sentiment indicator. In May 2026, CoreLogic reported a national auction clearance rate of 54.3%, down from 63% a year earlier. The last time clearance rates were this low for a sustained period was during the 2018–19 downturn.
Key sub-trends:
- Melbourne: Clearance rates have fallen below 50% in the inner east and Bayside areas, where mid-century homes often require renovation budgets buyers no longer have.
- Sydney: Even the lower north shore, typically resilient, is seeing one in three auctions pass in.
- Brisbane, Adelaide, Perth: Clearance rates are holding in the high 50s, but this masks a sharp increase in cancelled auctions — vendors are pulling the plug when pre-auction interest is low.
Q: Is it better to sell via auction or private treaty in this market?
Data from REA and Domain for Q1 2026 suggests that private treaty sales are outperforming auctions for non-prestige properties. For homes valued under $1.5 million, the median premium achieved at auction has fallen to 1.2% above the final asking price, down from 5.4% in 2022. Unless the property is genuinely unique or has dual-income development potential, a well-priced private treaty campaign with a clear deadline rarely underperforms an auction — and costs the vendor significantly less in marketing fees.
The Affordability Lock-out: How Many Buyers Have Disappeared?
We can quantify the buyer pool contraction using ABS housing finance data and RBA loan-level statistics. In 2021, at the trough of the rate cycle, approximately 68,000 new owner-occupier housing loan commitments were approved per month (seasonally adjusted). In 2026, that figure runs closer to 48,000 — a 29% decline, even though the population has increased by roughly 1.2 million people over the same period.
The squeeze is sharpest among:
- First-home buyers: Their share of new loans dropped from 28% in 2021 to 21% in 2026, as deposit hurdles became insurmountable.
- Upgraders: Households looking to move from a $700,000 property to a $1.2 million property now face an additional $2,800 per month in interest costs compared with 2021, based on a 6.72% variable rate.
- Interest-only investors: With IO rate premiums widening to 60–80 basis points above principal-and-interest loans, investment loan commitments have fallen 22% from their 2024 peak.
Q: What types of homes are hardest to sell right now?
Properties requiring significant renovation or carrying unresolved building defects are sitting longest. CoreLogic’s May 2026 report shows that “renovator’s delight” listings in middle-ring Sydney and Melbourne now average 83 days on market, compared with 41 days for turnkey properties in the same postcodes. The cost of construction materials remains 28% above pre-COVID levels (ABS Producer Price Index), meaning buyers cannot finance a renovation cheaply on top of a 6.72% mortgage. Similarly, apartments with cladding or waterproofing issues flagged in strata reports are virtually unsellable without steep discounts, as banks are increasingly reluctant to lend against them.
Pricing Realism: The Only Strategy That Works in 2026
If there is one piece of advice the data supports unequivocally, it’s this: price to the market you have, not the market you remember.
Sellers anchored to 2021–22 sale prices are listing 10–15% above transactable levels and then chasing the market down with incremental reductions. CoreLogic data shows that properties that sell within the first 30 days of listing achieve 98.2% of the initial ask, on average. Properties that remain unsold past 90 days achieve 89.4% — and the total discount from initial list to final sale is larger even though the headline reduction looks modest, because holding costs (council rates, insurance, mortgage interest) accrue.
Pricing playbook for sellers:
- Get a paid independent valuation, not just an agent CMA. Agents in a slow market often over-quote to win the listing.
- Benchmark against comparable sales from the last 90 days, not last year. Conditions changed materially in early 2026.
- Set an online listing price — CoreLogic found that properties without a listed price spend 19 extra days on market.
- Offer a buyer incentive: in June 2026, 26% of successful sales included a vendor contribution toward stamp duty or a rate buydown, according to PropTrack.
Frequently Asked Questions

Q: Are all capital cities equally affected by the high-rate slump?
Not equally. Perth and Adelaide are holding up better because their median prices are still meaningfully lower than Sydney and Melbourne, and net interstate migration continues to support demand. However, even these cities have seen absorption rates decline in the June 2026 quarter as mine-sector uncertainty weighs on confidence.
Q: Should I consider renting out my property instead of selling?
Gross rental yields in most capitals have risen to around 3.8–4.2% for houses and 5.0–5.5% for units, which can help service the mortgage. However, if you are carrying a variable-rate debt at 6.72%, the net holding cost after tax is still negative for many landlords. A holding strategy makes sense only if you have at least a 24-month cash buffer and do not foresee a need to access equity.
Q: Will the market improve if the RBA cuts rates in late 2026 or early 2027?
Rate cuts will help at the margin, but they are unlikely to trigger a sharp snap-back in prices. Listing volumes have built up over two years, and CoreLogic estimates that pent-up supply could take 9–12 months to clear once buyer activity normalises. Economists forecast that a 50-basis-point cumulative cut would improve maximum borrowing capacity by roughly 6%, which is meaningful but does not offset the 32% decline from the 2021 peak.
References
- RBA Cash Rate & Statistical Tables (2026) — https://www.rba.gov.au/statistics/cash-rate/ — The official source for the Reserve Bank of Australia’s cash rate decisions, supporting the 4.35% figure and lending rate data.
- CoreLogic Monthly Housing Chart Pack (May 2026) — https://www.corelogic.com.au/our-research/monthly-housing-chart-pack — CoreLogic publishes the most widely cited data on clearance rates, days on market, and listing volumes in Australia.
- APRA Quarterly ADI Property Exposures (March 2026) — https://www.apra.gov.au/quarterly-adi-property-exposures — APRA’s statistics underpin the analysis of serviceability buffers and lending volume trends.
- PropTrack Housing Market Indicators Report (June 2026) — https://www.proptrack.com.au/insights/ — REA Group’s data arm provides timely transaction volume, vendor discounting, and buyer enquiry metrics referenced in the pricing strategies section.